Photoelectric imaging/Gas Discharge Visualization (EPI/GDV)
Overview
The purpose of this preliminary study is to discover the effects of cprime chip technology on Fiji’s water through photoelectric imaging/gas discharge visualization (EPI/GDV) system imaging. The technology generates an electrical pulse to the target, and the target responds in the form of electrons or photons. A gas discharge is generated in the electromagnetic field, and the digital camera will capture the light radiated by this photon, and then process it through cutting-edge software to form a report. Bio Antenna chips and Fiji water were used in the samples.
Dr. Gaetan Chevalier (Dr. Gaetan Chevalier) used photoelectric imaging/gas discharge visualization (EPI/GDV) material testing equipment to conduct this experiment at the Encinitas Psychological Technology Laboratory in California.
Methods
Two samples of Fiji water are contained in two 10oz. glass bottles. The control bottle (no chip, no bracelet) is always at least 10 feet away from the cprime chip technology product and the bottle being tested. Place a piece of Bio Antenna chips on the bottom of the test bottle, put a bracelet on the bottle, and leave it for 1 hour before performing GDV measurement.
Take 6 drops of water in each bottle and test twice. Use a clean tuberculin syringe for each bottle independently. Before using the syringe, flush the syringe and fill up the water sample before taking the water drop test.
GDV takes images at 5 frames per second, and each measurement takes 24 seconds to form 120 images (each water sample or bottle of water is tested for 12 times in total). The first 20 pictures of each drop of water are discarded.
The 1,200 pictures left were used for the analysis of the two water samples. The analyzed parameters include: range, average intensity, shape factor, entropy and spatial fractal.
Main Researcher
Dr. Chevalier
Dr. Chevalier received his Ph.D. in Engineering Physics from the Polytechnic Institute of the University of Montreal. Here, he became the first person to measure the atomic magnetic dipole and the quadrupole moment of the 91Zr isotope. Later, he entered the National Scientific Research Institute in Varenne, Canada (near Montreal) as a post-doctoral scholar, where he developed a carbon probe to measure the center of the inner wall of the “Tokamac de Varennes”. Sexual particle flow. After that, he went to the University of California, Los Angeles, first as a postdoctoral scholar in the PISCES group of the M.A.N.E. (mechanical, aeronautical, and atomic engineering) department; later, he became a staff member of the low-energy plasma group in the Department of Mechanical and Electrical Engineering. He is also the research director of the Department of Humanities at the College of California.
Key findings, GDV (Gas Discharge Visualization) image analysis
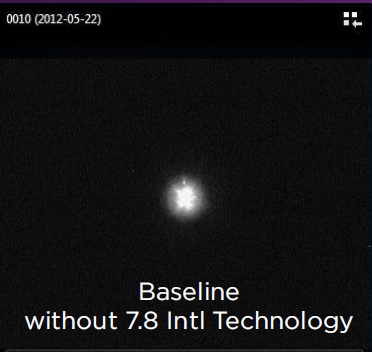
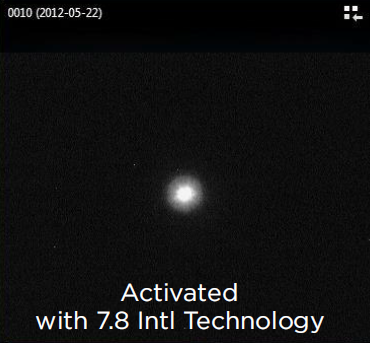
The baseline measurement chart (above) shows a clear bright area that is larger than that of a 60-minute test sample exposed to cprime chip technology (below).
These two pictures show the halo produced by a drop of Fijian water presented with GDV. They are images taken and recorded by the aforementioned capture software for 24 seconds.
The picture above is the 70th picture of Fiji water (control water sample) without the chip or bracelet in the 10th measurement (the 5th drop of water in the second measurement).
The picture below is the 70th picture when the Fiji water (test water sample) with the chip and bracelet was used for the 10th measurement (the 5th drop of the second measurement).
Please note that these two pictures have not undergone any processing. This can be seen from the two sets of data that are consistent in the upper left corner of the picture. These numbers are automatically generated by the analysis software (GDV scientific laboratory software version 2.2.9) and represent the number of measurements (left) and date.
Key findings, GDV (Gas Discharge Visualization) image analysis
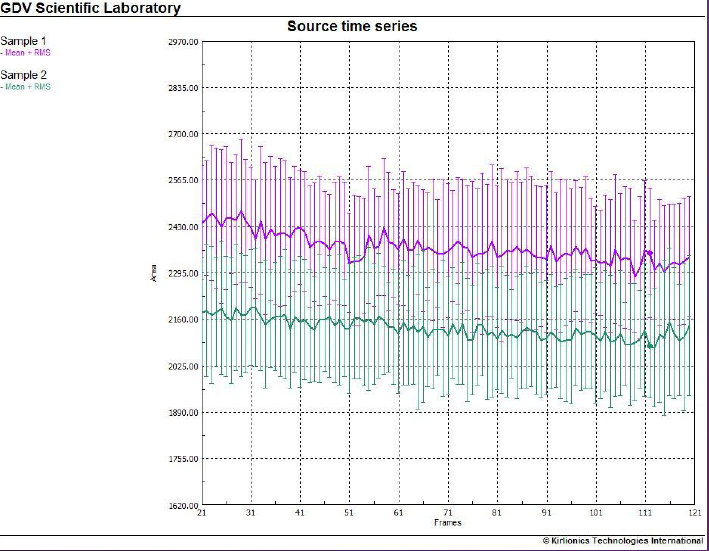
Light-emitting area:
Comparative sample 1 (purple line and vertical line) shows an area of visible light; this area is larger than the test sample (green line and vertical line) exposed to cprime chip technology for 60 minutes.
The chart shows a time series of 1,200 images of two water samples. Each frame in the table represents the average of 12 pictures of each type of water, and the vertical line represents the RMS (root mean square) deviation or standard deviation of these 12 pictures.
Affected by known unstable factors, the first 20 pictures of each measurement are removed (the international standard principle suggested by the manufacturer).
It can be seen that sample 1 is higher than sample 2, which means that the light-emitting area is larger and statistically more obvious.
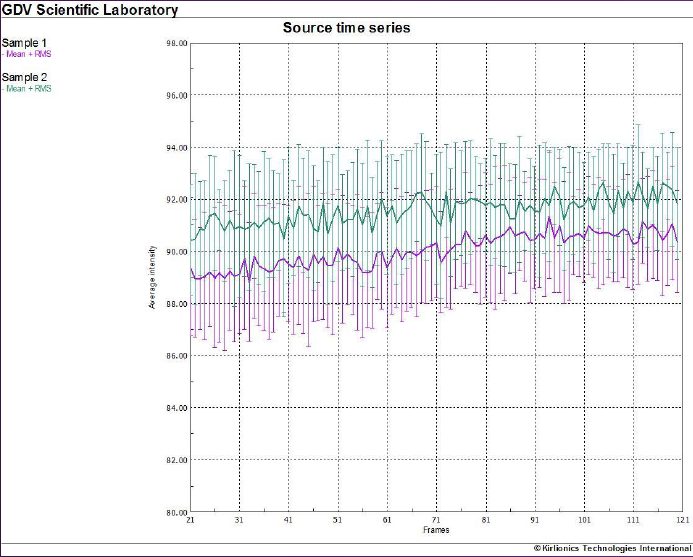
Average intensity
The chart shows a time series of 1,200 images of two water samples, showing the average intensity of Fiji water for each sample. Similarly, due to the potential instability of the pictures, the first 20 pictures of each measurement were eliminated.
The picture shows that the reference sample Fiji water (the water in the bottle without the chip or bracelet) has a lower average strength than the test sample.
However, the parameter T test showed that there was no significant statistical difference between the average intensity of the Fiji water (p = 0.2577) of the two samples.
Nevertheless, the difference between the two also illustrates a noteworthy trend, because there may be certain conditions that can increase the difference, such as keeping your hands around the water bottle longer. Therefore, even if the statistical data is not significantly different, this low probability is still sufficient to allow future research to pay more attention to this parameter.
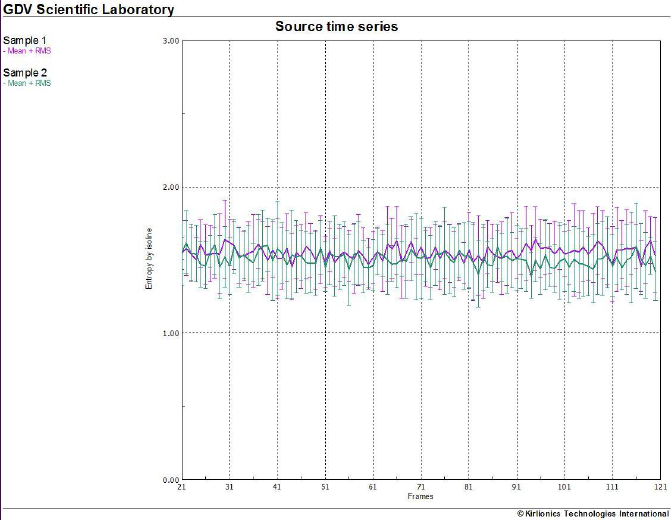
Entropy, shape coefficient and spatial fractal
This time you can clearly see that because the two lines overlap, there is no difference between the two samples.
The graph shows that the test data of entropy lacks the same difference as the data of shape coefficient and spatial fractal.
Conclusion
Through EPI/GDV, comparing untreated Fiji water and Fiji water exposed for 60 minutes under the 7.8 international technology, the luminous area is obviously different.
It is assumed that the difference between the luminous area and the average intensity of the two samples reflects the difference in a specific autologous tissue of the survey sample. The fact that the Fiji water luminous area using the Bio Antenna bracelet and chip is smaller, but the discharge is likely to be stronger, indicates that the trajectory of free electrons on the near surface of this water sample is smaller, maybe , The test sample has more free electrons in this range.
Compared with the reference water sample, the bottle with the Bio Antenna Chip underneath and the bracelet may accumulate more low-energy ions near the surface. This situation shows that although the near surface layer may release more load (perhaps greater intensity), the measured water can maintain a better load (smaller light-emitting area).
These results indicate that the electron flow and coherence in the molecule have become stronger after the water under test is exposed to the 7.8 international technology.